
Your agent returned the wrong answer. Can you explain why?
How to design traces, spans, metadata, sampling, and quality signals that make production AI failures explainable without logging everything.
 Bart LuderaCEO
The ticket says, "The agent gave the customer the wrong overdraft policy."
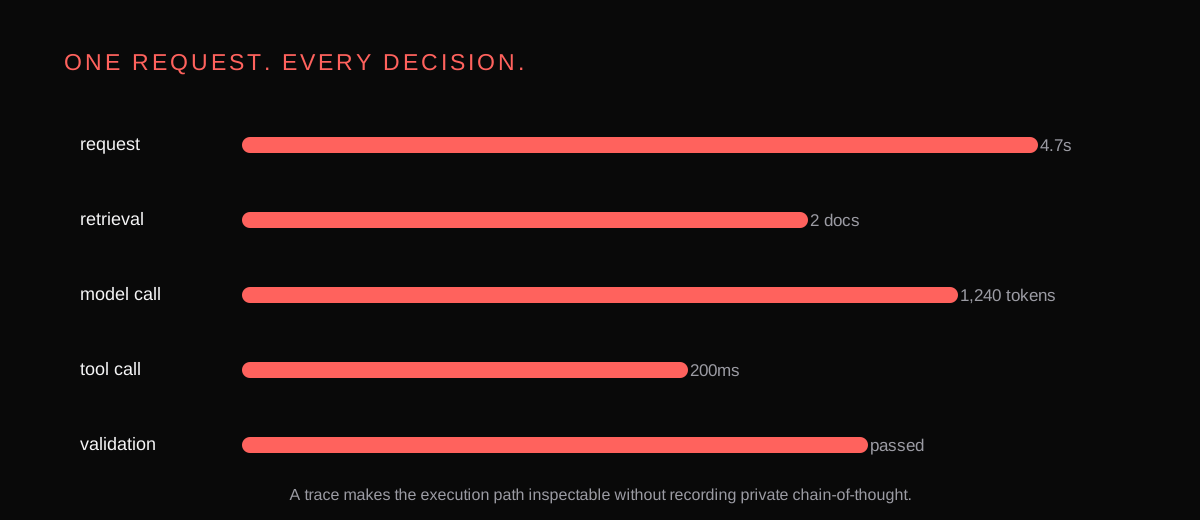
Your API dashboard shows a 200 response in 4.7 seconds. The model provider reports no outage. Nothing crashed.
That leaves at least eight plausible causes. Retrieval returned an old document. A permission filter removed the right one. The model ignored good context. The policy tool timed out. A retry followed a different path. The prompt changed. The model changed. Output validation passed a sentence it should have rejected.
If all you have is an HTTP log, the incident has already turned into guesswork.
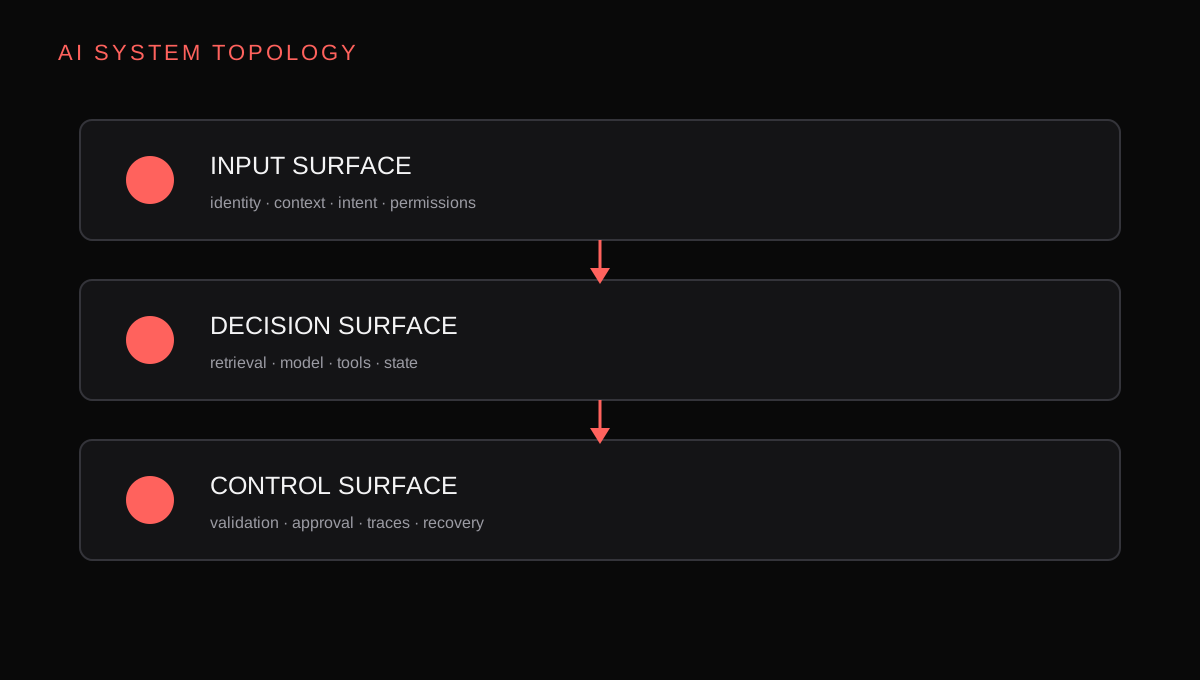
A banking request may pass through intent classification, account lookup, policy retrieval, model inference, validation, and response generation. That entire sequence is the unit an AI operator needs to inspect.
Trace decisions, not hidden thoughts
Agent observability does not require storing private chain-of-thought. It requires a structured record of what the system received, which operations it performed, which external facts it used, and what each boundary returned.
A useful trace might look like this:
trace: fee-dispute-8f72
  classify_intent
  load_customer_account
  retrieve_policy
  generate_decision
  validate_decision
  request_human_approval
  return_response
Each operation is a span with timing, status, version metadata, and sanitized inputs and outputs. The tree answers questions a flat log cannot. Which step consumed the latency? Which retriever result reached the model? Did validation run? Which tool call was retried?
LangSmith uses the same hierarchy. A trace represents one operation and contains runs for model calls, retrieval, tools, prompt formatting, or custom application steps. Related traces from a conversation can be linked as a thread.
OpenTelemetry uses spans inside traces. Its GenAI semantic attributes cover operations such as model calls, tool execution, retrieval, agent invocation, and workflow invocation. The standard is still developing, so treat your internal event schema as a versioned contract rather than assuming every backend will interpret it identically.
Design a span taxonomy before adding instrumentation
Auto-instrumentation can capture model and framework calls in minutes. It cannot decide which business transitions matter.
Start with a small taxonomy:
request
  auth
  route
  retrieve
  model
  tool
  validate
  approve
  side_effect
  respond
Use low-cardinality span names. tool.get_account is queryable. tool.get_account.customer_739205 creates an unbounded set of names and makes aggregation expensive. Put identifiers in attributes, then hash or redact them according to policy.
Record a stable operation ID across retries. A retry is a new attempt, not a new business operation. Without both identifiers, duplicate tool calls look like unrelated work.
{
  "trace_id": "8f72",
  "operation_id": "fee-review-1842",
  "attempt": 2,
  "workflow_version": "fee-agent-2.8.1",
  "prompt_version": "decision-17",
  "model": "provider:model-version",
  "retrieval_index": "policy-index-31"
}
Version metadata belongs on every trace because it is the join key between deployment history and changed behavior.
Record enough context to reproduce the path
For model calls, capture provider, model version, parameters, input and output token counts, latency, retry count, and the prompt template version. Store rendered content only when policy allows it.
For retrieval, capture the query, filters, index version, document IDs, document versions, scores, and latency. A list of IDs is often enough to debug freshness without copying full confidential documents into the trace store.
For tools, capture the tool name, sanitized arguments, authorization decision, result status, latency, retry attempt, and side-effect operation ID. Never rely on the LLM to tell you whether authorization succeeded. Record the decision made by the policy layer or downstream service.
For graph execution, capture node transitions, checkpoint ID, interrupt reason, retry budget, stop reason, and final state classification.
For output, record validation results, evaluator scores, escalation, and explicit user feedback. Keep user feedback distinct from correctness. A customer can dislike a correct refusal.
Do not turn the trace backend into a data breach
The most useful fields are often the most sensitive. Prompts can contain personal data. Tool arguments may contain account numbers. Retrieved chunks may include contracts or employee records.
The OpenTelemetry GenAI registry warns that tool arguments and results may contain sensitive information. Instrumentation should not export them by default just because the SDK can.
Use a field-level collection policy:
tool.get_account:
  capture:
    - account_type
    - result_status
    - latency_ms
  hash:
    - customer_id
  drop:
    - account_number
    - full_name
    - balance
Apply redaction before data leaves the application boundary. Redacting only in the UI leaves raw values in transport, queues, and storage.
Separate access to production traces from access to application logs. Set retention by data class. Test deletion. If a trace references a document rather than embedding its full content, the document can remain under its original access and retention rules.
Trace retries as first-class behavior
Retries are where many agent systems hide cost and correctness defects.
A final successful span can conceal two timeouts and one ambiguous side effect. Record every attempt as a child span and preserve the shared operation ID.
tool.create_refund
  attempt 1: timeout after request sent
  reconciliation: refund found by operation ID
  attempt 2: skipped
  result: existing refund returned
For read operations, a bounded retry may be harmless. For writes, the trace should show the idempotency key and any reconciliation step. If the downstream API has no idempotency support, the runbook needs a different containment strategy.
Behavioral evaluation can run over the trace. Flag duplicate reads, repeated tool arguments, unbounded loops, fallbacks, and writes that bypassed approval. Three database calls for one balance lookup are already a defect even when the final answer is correct.
Add quality signals to operational telemetry
Traditional dashboards answer whether the service is available. Agent dashboards also need to answer whether the service is behaving well.
Track distributions rather than one average:
- task completion by intent and risk tier
- escalation and abstention rates
- retrieval success and empty-result rates
- tool calls per completed task
- validator failures
- online evaluator scores
- cost per successful task
- negative feedback with confirmed error labels
A rising escalation rate can indicate a model regression, a missing data source, or a stricter safety policy. The metric tells you where to start. The traces tell you which cause is present.
LangSmith online evaluators can score production runs or threads and attach feedback to traces. Sample expensive judges, but run cheap safety and schema checks more broadly. Use filters to spend evaluation budget on high-risk intents, new deployments, long trajectories, and negative user feedback.
Sampling should preserve incidents
Uniformly storing 1% of traffic is simple and often wrong.
Keep all traces that contain errors, policy violations, human overrides, negative feedback, unusual cost, or new release versions. Sample routine successful traffic at a lower rate. Increase sampling during canaries and after model, prompt, tool, or retrieval changes.
Tail-based sampling is useful because the decision happens after the trace completes. The collector can retain traces that exceeded latency, produced an error, or triggered a risk signal. Make sure the application still emits enough metadata for the collector to decide.
If regulations or internal audit policy require complete records for a class of high-risk operations, sampling is not appropriate for that class. The policy has to be explicit.
Alert on change, not isolated weirdness
One long trace may be a difficult case. A shift in the p95 trajectory length after a deployment is a signal.
Alerts should combine volume, duration, and severity. Examples:
critical policy error count above zero
authorization denial rate triples for 15 minutes
median tool calls per success rises by 40 percent
groundedness falls below the release baseline for 30 minutes
cost per completed task exceeds its budget for one hour
Attach representative trace links to the alert. An operator should land on the failed path, not a dashboard that requires another search.
Keep quality alerts separate from infrastructure alerts while routing both into the same incident process. A healthy API can serve bad answers. A high-quality agent cannot serve anyone if its tool gateway is down.
Connect traces to the rest of the company
Trace data becomes more useful when it shares identifiers with deployment, customer-support, and incident systems.
A production trace should link to the application release, prompt and dataset versions, feature flags, and incident ticket. The incident should link back to a saved trace cohort, not one cherry-picked example.
Use OpenTelemetry when you need a common telemetry path across application services and frameworks. Use LangSmith when the team needs agent-specific trace inspection, datasets, experiments, and feedback workflows. They solve overlapping but different parts of the problem, and neither requires you to abandon normal service metrics and logs.
Explainability is an operational capability
Build the trace store around one operating need: answer a concrete failure report in minutes. A forensic archive nobody can query will not do that.
Can the on-call engineer identify the workflow version, source documents, tool calls, permission decisions, retries, validation outcome, and evaluator scores for one request? Can they find similar traces? Can they determine whether the failure started after a release or data update?
If not, the agent is still opaque even if every model call is technically logged.
The next article follows the source documents behind those traces: Production RAG is a data lifecycle, not a vector database